Data extraction laboratory
The VARIoT project aims to generate and provide open access information related to the security of the Internet of Things. To reach such objective, project partners are looking at different perspectives of IoT security data. This post describes the IoT network behavior analysis, allowing the discovery of vulnerabilities and traces made openly available through the European Data Portal. VARIoT’s consortium’s member Mondragon Unibertsitatea is already working towards these goals.
This blog entry explains the topology used for capturing the IoT traffic and extracting the network features from it, which has resulted in various datasets.
What tools make up the laboratory?
Laboratory is composed of various tools for capturing traffic and feature extraction process:
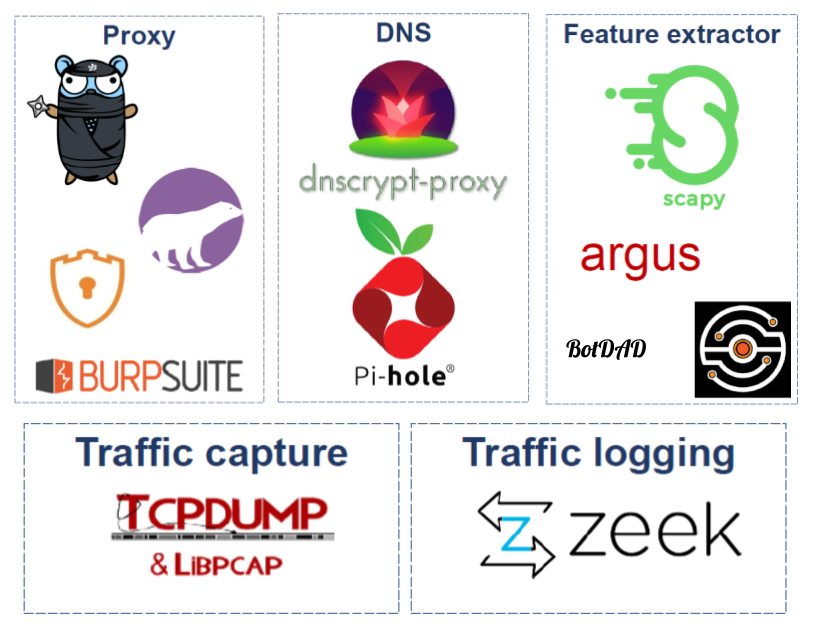
First, for the IoT traffic capture and feature processing both (1) TCPDump and (2) Zeek (formerly Bro) are used. While TCPDump is used to capture traffic, the second one generates the transaction logs. Moreover, for those devices using TLS traffic, various proxies such as Burp Suite, PolarProxy, Bettercap or mitmproxy are used.
Network traffic feature extraction is performed by various tools. These include Argus and CICFlowMeter, which convert the traffic into bidirectional flows and extract over 120 features, or BotDAD, which takes the DNS traffic and makes a DNS fingerprinting based on it.
Last, in order to extract more information and at the same time bypass any DNS filter, DNSCrypt-Proxy is used to forward the requests to the desired DNS servers using DNS over HTTPS (DoH). In addition, Pi-hole is used as DNS sinkhole to manage all the requests (and save all the information).
But, how do these tools interact?
The following diagrams explain how these tools interact with each other to get all the desired information:
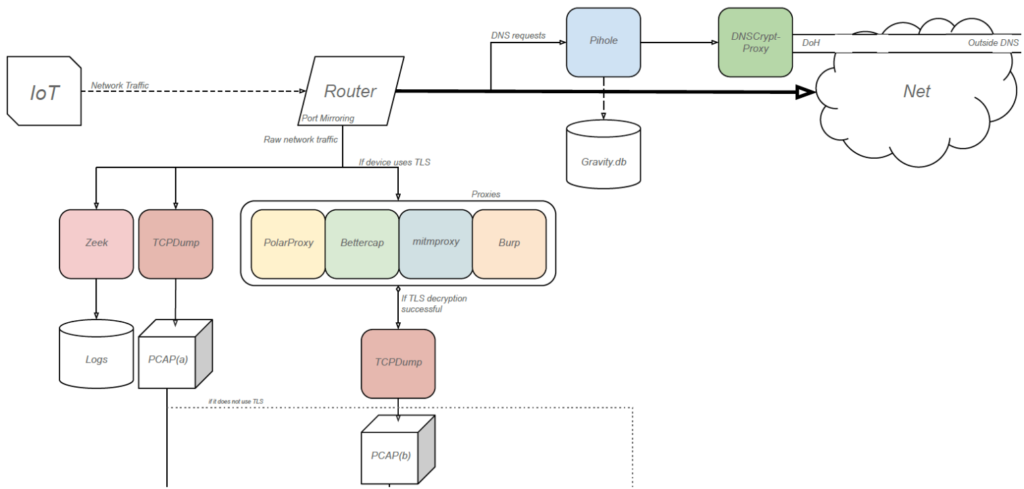
In this first part of the diagram, the outbound traffic from the IoT device reaches the laboratory, acting as a router. From there, DNS requests are redirected to Pi-hole and the traffic is meanwhile captured and logged.
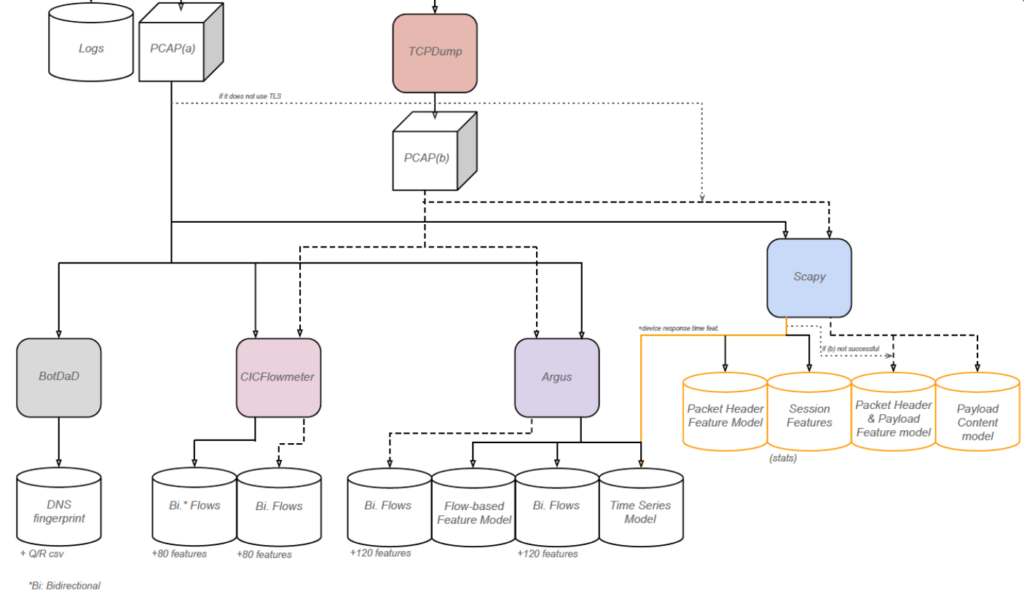
Once the IoT traffic is captured, the respective tools are used to generate the different data models that compose the datasets using the mentioned tools, each one based on its corresponding PCAP file.
The current laboratory
The following diagram shows, in a general way, how the laboratory works:
All introduced tools run on a Debian 10 virtual machine inside a Debian 10 host, which has a Wi-Fi dongle connected to work as an Access Point for the IoT devices.
The script executes a tmux session in which various Docker containers are launched, each with the needed tools to perform traffic capture and logging. These are the previously mentioned Pi-hole, DNSCrypt-Proxy, TCPDump and Zeek (and the proxies if necessary), combined with hostapd to generate a Wi-Fi hotspot. Once everything is up, the IoT device is connected and its network traffic is captured and logged. After the capture, the tmux session finishes.
Once the pcap file is ready, with the help of another script, a second tmux session is created and some other containers are launched. These containers contain the needed tools to generate the selected feature models that will compose the datasets. This part is scalable as different tools can be added or changed depending on the goal. The extracted data is then classified and validated and ready to be published into the European Data Portal.